
Why Most Gas Sales in the United States Happen at Convenience Stores
Most Gas Sales in the United States happen at convenience stores because you benefit from competitive pricing and the strong link between fuel and in-store purchases. You see this dominance clearly:
Gas dispensers and pumps play a key role in attracting you to these stores. Clean, well-lit fueling areas and advanced payment systems build trust and encourage repeat visits. The presence of these features draws traffic, justifies store locations, and supports a business model that appeals to drivers and companies in transport, agriculture, and construction.
- Convenience stores sell most gasoline in the U.S. because they offer competitive prices and attract customers with clean, safe fueling areas and fast payment options.
- Gasoline sales have very low profit margins, so stores rely on in-store purchases like snacks and drinks to make most of their profits.
- Independent owners run over 95% of gas stations, allowing them to adjust prices and services to local needs and create unique business models.
- Drivers choose where to buy fuel mainly based on price and convenience, favoring stations that offer quick service and easy access.
- The rise of self-service fueling and electric vehicles is changing the market, pushing convenience stores to adopt new technologies and offer EV charging to stay competitive.
Gas Sales and Profit Margins
Low Margins
You might think selling gasoline brings in big profits, but the reality is different. Gas Sales at convenience stores operate on very slim margins. On average, you see a gross profit margin of about 15% per gallon, which equals roughly 52 cents per gallon when gas costs $3.50. After subtracting expenses like credit card fees, utilities, and maintenance, the net profit margin drops to about 1%, or just 3.5 cents per gallon. These numbers show that fuel alone cannot sustain a business, especially when you consider how much prices can change throughout the year.
Note: Gasoline profit margins often peak in the second half of the year due to seasonal price drops and changes in fuel formulation. However, these peaks are short-lived, and margins remain tight for most of the year.
Intense competition keeps prices low. You and other drivers often choose where to fill up based on price, location, and safety. Most stations cannot raise prices without risking a loss of customers. Big-box retailers like Walmart can offer even lower prices because they sell higher volumes and have greater cost efficiencies. This puts extra pressure on independent operators to keep their prices competitive, even if it means making less profit per gallon.
In-Store Revenue
Because Gas Sales bring in so little profit, convenience stores rely on in-store purchases to stay profitable. When you stop to refuel, you often head inside for a drink, snack, or meal. These items carry much higher profit margins than fuel. For example, dispensed beverages and prepared foods can account for over a third of in-store gross profits.
Even though fuel sales make up the majority of total revenue, in-store sales generate most of the profit. In 2023, convenience stores earned about $860 billion in total sales. Of this, in-store purchases contributed $327.6 billion, or about 38.2% of revenue, while fuel sales made up $532.2 billion, or 61.8%. Yet, in-store sales delivered over 60% of gross profit dollars.
You see this dynamic every time you visit a convenience store. Gas dispensers and pumps act as magnets, drawing you in with clean, well-lit areas and fast payment options. Once you start fueling, you notice promotions on the pump screen or inside the store. About 58% of drivers enter the store after fueling, and most buy drinks, snacks, or meals.
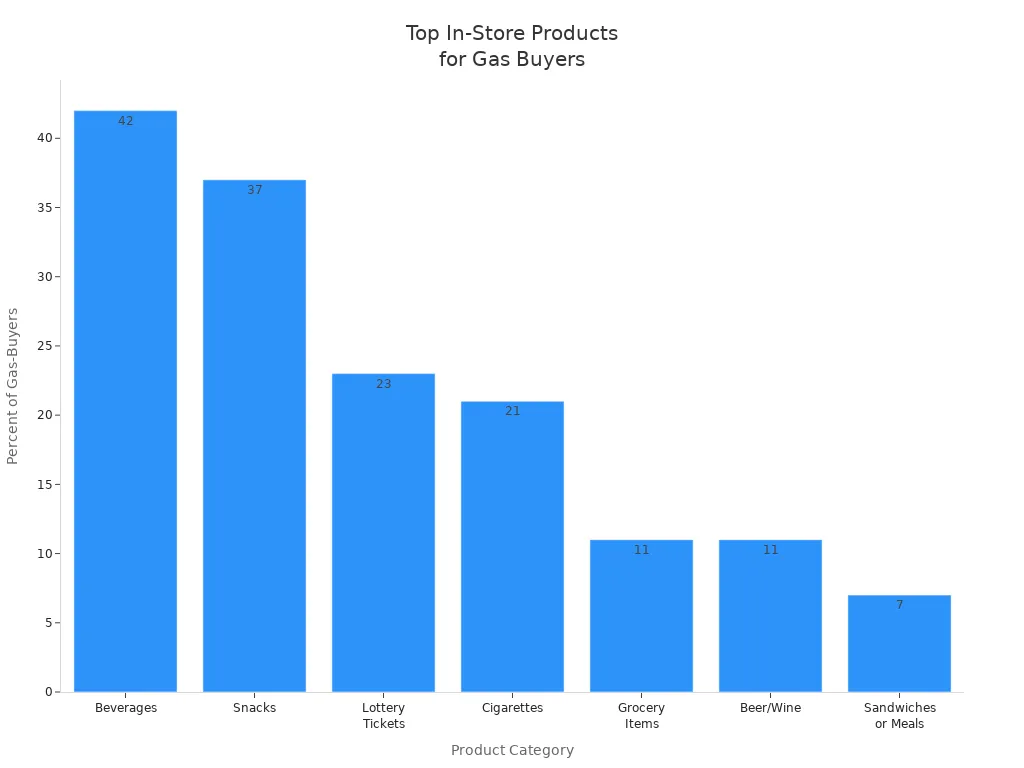
You might grab a cold beverage (42% of gas-buying customers do), a snack (37%), or even a lottery ticket or sandwich. These purchases add up quickly and help offset the razor-thin profits from Gas Sales.
Tip: If you operate a convenience store or supply equipment to the industry, focus on optimizing your in-store offerings and pump area experience. Cleanliness, safety, and quick service not only attract more drivers but also increase the chances they will make additional purchases.
Gas dispensers and pumps also serve as powerful marketing tools. On-screen promotions, loyalty programs, and the ability to order food or coffee at the pump encourage impulse buys. These features reduce wait times and make the overall experience more appealing, especially for truck drivers, fleet operators, and businesses in transport or construction who value efficiency.
For companies involved in gas station construction, fuel dispenser manufacturing, or supplying parts for industrial vehicles, understanding this synergy between Gas Sales and in-store revenue is crucial. The right equipment and store layout can boost both traffic and profits, making your business more resilient to fuel price swings.
Ownership Structure
Independent Operators
You encounter a unique landscape when you look at gas station ownership in the United States. Most stations are not owned by major oil companies. Instead, independent operators run over 95% of all locations. You see a breakdown in the table below:
Independent operators have full control over pricing, supplier selection, and service offerings. You can tailor your convenience store to local needs, add profit centers like car washes, or offer specialty products for truck drivers and fleet operators. You keep all profits from operations, but you also bear the responsibility for marketing, maintenance, and compliance. If you operate a station, you choose between several business models:
If you work in gas station construction, maintenance, or supply, you benefit from the flexibility and demand for customized solutions that independent owners require. You see opportunities to provide equipment, parts, and services that help operators stand out in a competitive market.
Decentralization
Decentralization shapes the industry. You notice that independent ownership allows stations to respond quickly to local market changes. You set prices based on competition, adjust product offerings for truck drivers or agricultural customers, and modify store layouts to boost sales. Unlike franchise models, you avoid ongoing fees and strict operational rules, but you miss out on national marketing support.
Note: Regulatory factors play a major role in your operations. You must comply with environmental standards, equipment regulations, and lease agreements. Franchise agreements may set fuel quotas and rebates, while environmental history can affect your ability to operate or transfer ownership.
- Franchise agreements govern operational terms such as fuel sales quotas and approval of station purchase.
- Ownership and maintenance of Fuel pumps and tanks require strict regulatory compliance.
- Environmental regulations may impose costly remediation for contamination.
- Lease agreements and landlord consent impact station transfer and operation.
- Equipment standards affect usability and profitability.
- Location and seasonality influence customer base and competition.
You see that decentralization gives you the freedom to innovate and adapt, but it also brings greater responsibility. If you serve the industry, you help independent operators meet regulatory requirements, maintain equipment, and optimize their profit centers. This dynamic environment creates opportunities for businesses in fuel dispenser manufacturing, equipment supply, and station design.
Consumer Choices
Price Sensitivity
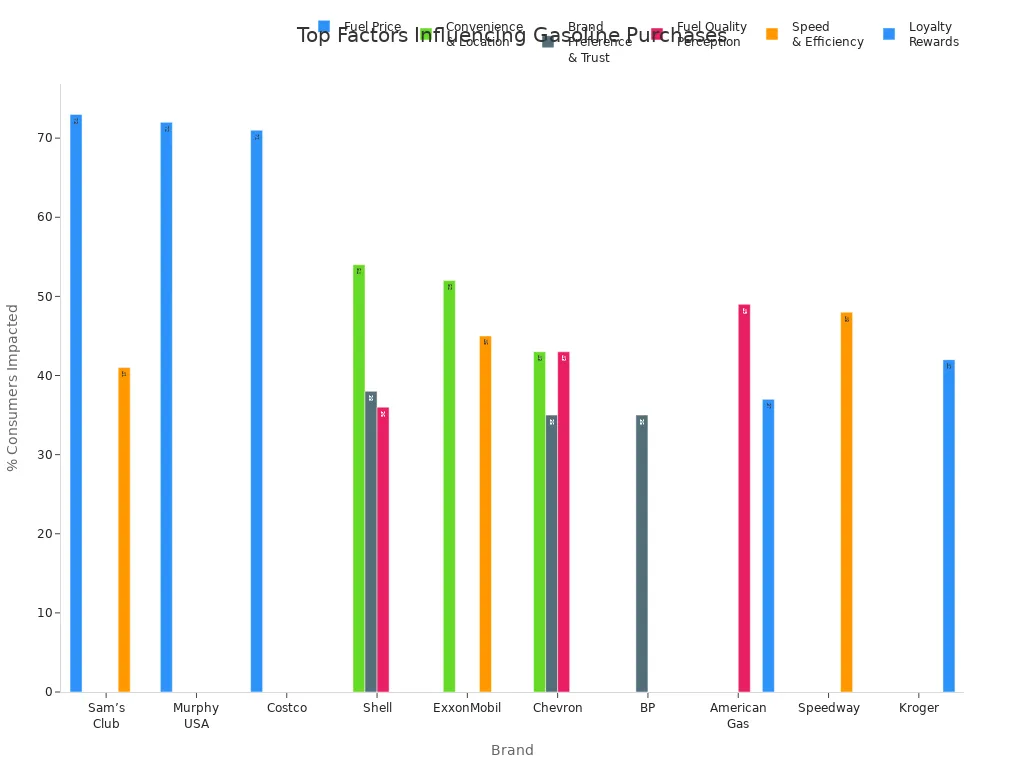
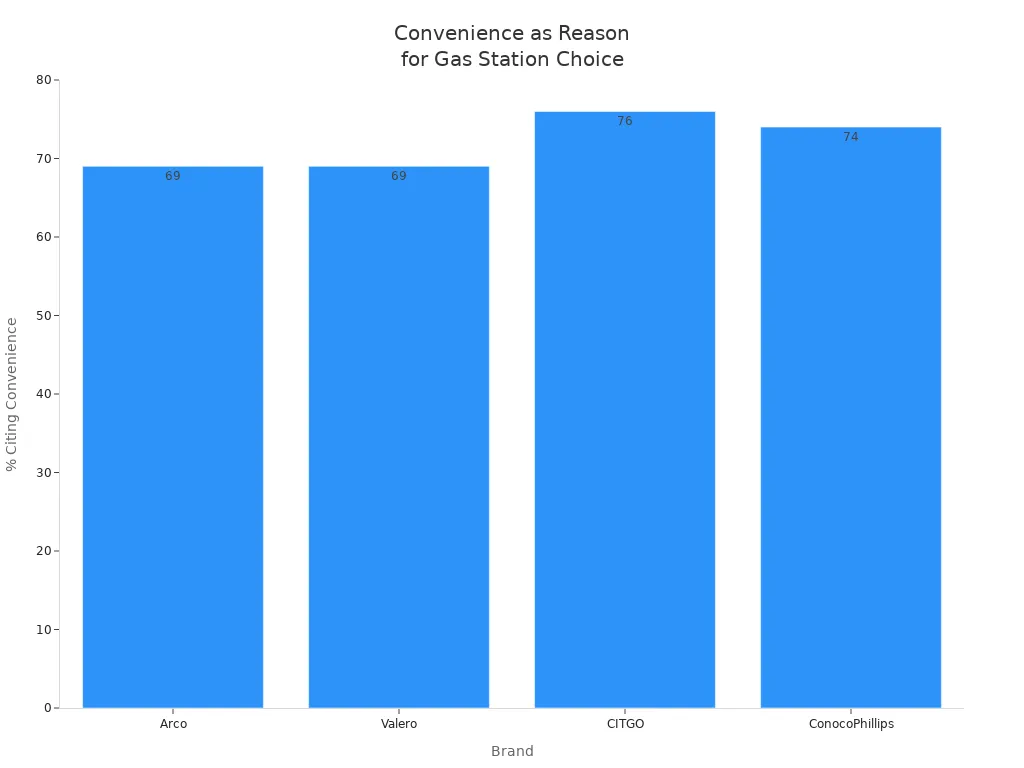
You make decisions about where to buy fuel based on price more than any other factor. Even a difference of a few cents per gallon can influence your choice, especially if you operate a fleet or drive long distances for work. Research shows that 73% of Sam’s Club customers, 72% of Murphy USA customers, and 71% of Costco customers choose these brands because of low fuel prices. This trend holds true for independent truck drivers, agricultural businesses, and companies managing large vehicles. When you see a lower price, you often change your route or switch brands to save money.
You notice that retailers adjust prices daily to stay competitive. If you manage a business in transport or construction, you track these changes closely to control costs. Gas Sales at convenience stores depend on this price sensitivity. When prices rise, you may limit trips or seek out stations with better deals, which impacts both fuel and in-store sales.
Convenience Factor
Convenience shapes your fuel buying habits just as much as price. You often choose stations located along your regular routes or near job sites. For truck drivers and fleet operators, easy access, wide lanes, and fast service matter. Clean restrooms, stocked shelves, and friendly staff also influence your decision to stop.
You expect a quick, frictionless experience. Many stations now offer mobile payments, loyalty programs, and self-checkout to speed up your visit. If you run a business in gas station construction or equipment supply, you see the demand for advanced fuel dispensers and efficient layouts. Cleanliness and safety remain top priorities, especially for drivers who spend long hours on the road. When you find a station that meets these needs, you are more likely to return and make additional purchases, supporting the ongoing success of Gas Sales at convenience stores.
Trends
Self-Fueling Growth
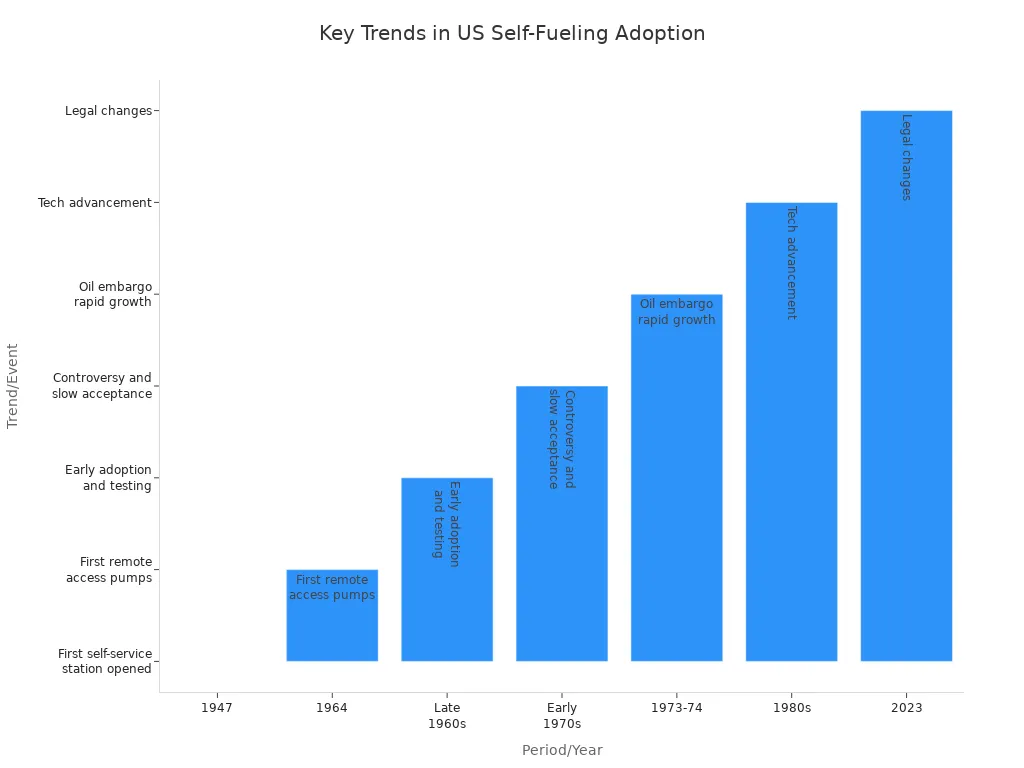
You have witnessed a dramatic transformation in how Americans buy fuel. The rise of self-service fueling stations changed the landscape for Gas Sales and convenience store operations. In 1947, Frank Urich opened the first self-service station in Los Angeles. Adoption remained slow at first, but innovation accelerated in the 1960s with remote access pumps. The OPEC oil embargo in the 1970s pushed consumers toward self-service for cost savings. By 1983, over half of convenience stores sold self-serve gasoline. Today, nearly every state allows self-fueling, with Oregon’s recent legal change leaving New Jersey as the only exception.
You see that self-fueling stations reduce operational costs and increase efficiency. This shift supports the dominance of convenience stores, but you also notice a decline in per-capita gasoline consumption. Improved fuel economy and electric vehicle adoption contribute to this trend, forcing stores to adapt.
Future of Gas Sales
You face new challenges as electric vehicles and alternative fuels reshape the market. The White House aims for half of new vehicles sold to be electric by 2030. Automakers plan all-electric fleets, and public charging ports now rival the number of gas stations. Much EV charging happens at home or at non-convenience store locations, reducing visits to traditional stations.
- Electric vehicles and alternative fuels decrease the need for traditional fuel stops.
- Up to 80% of fuel retail locations may become unprofitable by 2035 if EV adoption accelerates.
- Convenience stores must reinvent their business models to survive.
- Many stations now install EV charging ports and expand food offerings.
- Fuel retailers shift from vehicle-centric to customer-centric models, transforming assets and developing digital capabilities.
- Examples include 7-Eleven’s plan to install 500 EV charging ports at 250 locations.


